


Home
Products
emed/CL Software
Features included:
- dynamic and static pressure distribution measuring bi-directional
- audio signal for measurement stand-by
- automatic storage of measurement data
- storage of collected data with comments
- integrated overview display for up to 10 measurements with automatic recognition of left and right footstep
- display of each frame in rollover process (ROP)
- maximum pressure picture (MPP)
- display of sensor value for each sensor
- vertical force - time curve
- screen copy
- displays gaitline (center of pressure)
- maximum pressure - time curve
- contact area - time curve
- 1 : 1 printout of the pressure picture
- with pressure value for each sensor
- large footprints may be printed on LS printer - displays isobar pictures
- single picture static measurement
- dynamic, colour display of the ROP and the MPP in 3D with user defined angle of view
- calculates the averaged rollover process from single measurements with automatic storage to the database
- allows direct access to clinical foot reporting system (if installed)
- extract of a selected areas within one pressure picture (e.g. double contact) as one step or as different steps
- novel database emed light
- management of basic patient data
- creation of multiple databases
- initiates data acquisition
- access to all novel - software, if installed
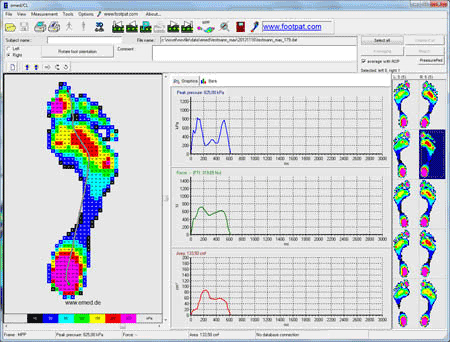
Screenshot of emed®/CL software
Subcategories
-
Product Sitemap
- Article Count:
- 75

Home
![]()
![]() This email address is being protected from spambots. You need JavaScript enabled to view it.
This email address is being protected from spambots. You need JavaScript enabled to view it.