


Home
A cycling lesson (100 minutes in total) was recorded using loadsol® insoles in cycling shoes. Scanning rate was set to 100 Hz. In the below screenshots the red curves are representing the total force in the left shoe, the blue curves those in the right shoe.
The following figure (from novel loadpad® analysis software) give an overview about the course of the whole lesson, consisting of a short warm up, periods of cycling with intermediate and stronger pedaling forces in a sitting position, short sections of pedaling in a standing position (weighing ride), a cool down period and stretching at the end of the lesson:
1) Course of the whole cycling lesson: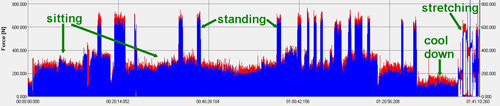
The next screenshots taken from an iPod show moments of typical movement patterns.
2) Sitting position, intermediate pedaling force (light ascent):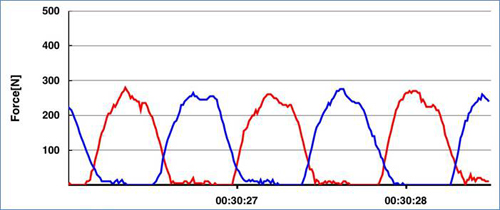
3) Sitting position, strong pedaling force (steep ascent):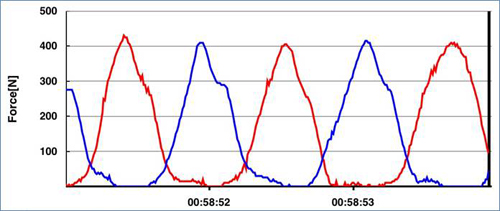
4) Standing position - note the different force scale: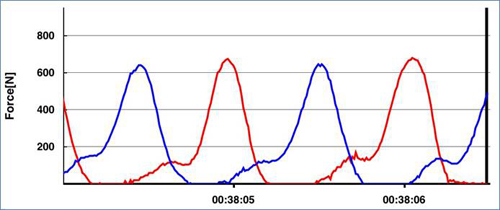
5) Sitting position, pedaling only with right leg (blue), then only with left leg (red) - note the different time scale: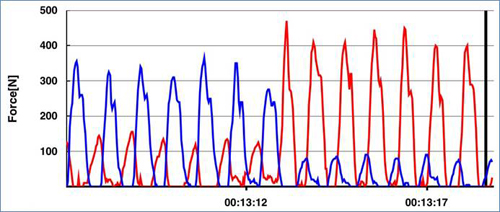
The measurement allows an evaluation of the training regarding the intensity of the individual phases, the applied peak forces, the mean forces, the balance between left and right leg, the cadence and the loading rate. The shape of the force curves allows conclusions to be drawn about the flow and uniformity of the pedaling. In addition, the athlete also receives visual feedback during training and can adjust the intensity accordingly.
Please have a look at www.loadsol.de.

Home
![]()
![]() This email address is being protected from spambots. You need JavaScript enabled to view it.
This email address is being protected from spambots. You need JavaScript enabled to view it.